We looked at over 100,000 customer conversations to quantify the gap between top and bottom performers. This post outlines our findings and steps you can take to start closing your Performance Gap today. What is the Performance Gap? On any team, from basketball to debate, professional to amateur, there are top performers and then there's everyone else. It’s usually pretty easy to spot the top performers. Their results speak for themselves, whether its championships, wins, awards, whatever the KPI might be. A recent study of more than 600,000 researchers, entertainers, politicians, and athletes found that high performers are 400% more productive than their peers. And studies of businesses reveal that this gap can grow to 800% for highly complex jobs.Why is this the case? Why can some uniquely outperform their peers? At Cresta, we call this the Performance Gap, and we think about it a lot! Why? Because aside from building AI that’s aimed at addressing it, we at Cresta believe this gap represents a huge opportunity for businesses. From both a personnel and a financial perspective. Imagine if every employee performed like a top performer?For sales, service, and retention teams, where performance is measured in terms of revenue, efficiency, and customer satisfaction (CSAT), the gap between top and bottom performers is measurable. So we dug into our data to see how much the Performance Gap is worth to businesses. At Cresta, we work with sales, care, and retention teams who have 100s if not 1000s of customer conversations every day. We analyzed over 100,000 of these conversations to see how much top performers outperform their peers.
We analyzed over 100,000 of these conversations to see how much top performers outperform their peers.
The Sales Performance Gap: [caption id="attachment_20867" align="aligncenter" width="499"]

The Sales Performance Gap: On average, top performers outperform bottom performers by a factor of 2.05x.[/caption]For sales teams, we looked at revenue per agent, a common KPI used to measure sales performance and productivity. We found, on average, top sales representatives outperformed their bottom quartile peers by 2.05x. In some cases, this number was as high as 3.5x. This means replacing one top performing sales representative would require 2-3.5 full time employees.What does this Performance Gap represent in terms of revenue? Getting every agent to perform like a top performer would, on average, grow annual revenue by 25%. For a $200M business unit, that’s a $50M opportunity!
Getting every agent to perform like a top performer would, on average, grow annual revenue by 25%. For a $200M business unit, that’s a $50M opportunity!
Contributing behaviors: What underlying behaviors contribute to the Sales Performance Gap? In short, top performers stick to the script. They follow prescribed sales methodologies and best practices. Here were some of our findings. [caption id="attachment_20859" align="aligncenter" width="686"]
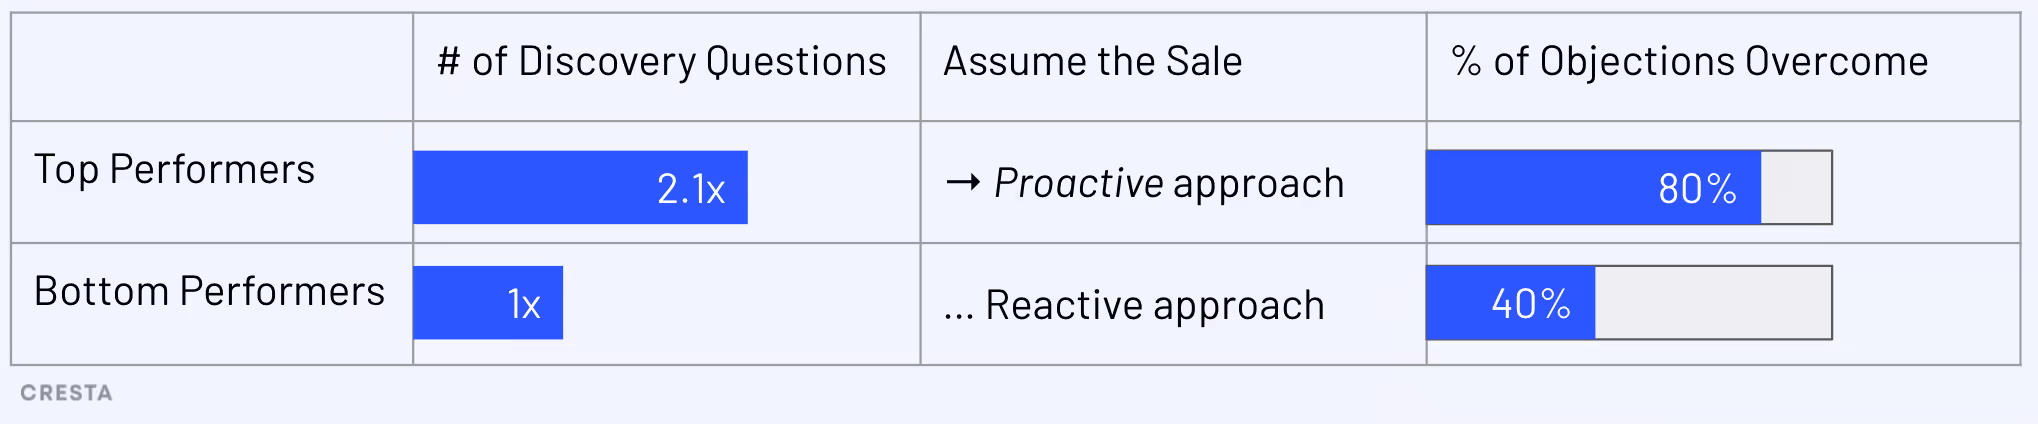
The top-3 contributing behaviors to the Sales Performance Gap.[/caption]
- Quality discovery: Discovery questions help a representative understand a customer's inquiry. Businesses often spend countless hours refining discovery questions to ensure they capture necessary information. We found top performers followed a repeatable and structured set of discovery questions to get to the root cause of a customer pain point. Top performers asked 2.1x more discovery questions than their peers. Having this information helped them better service customers and handle objections (#3 below)
- Assuming the sale: The assumptive selling technique, is when a salesperson intentionally assumes that the customer has already said yes to the sale. At the end of a conversation, top performing sales representatives proactively guided customers through the purchase process, assuming the sale 41% more often than the bottom quartile. In contrast, the bottom 25% of representatives took a passive approach, waiting for customers to ask how to complete the purchase.
- Handling objections: Last but not least, top performers were better at handling objections. They simply had a better grasp of the product or service they were selling. As a result, they could overcome customer objections 2x more effectively than their peers. Top performers overcame more than 80% of customer objections they were presented with, whereas the bottom quartile only overcame 40% of the customer objections they encountered.
While these behaviors might be easy to understand and identify, they are difficult to put into action. “Be better at overcoming objections!” isn’t the easiest piece of coaching to process. But more on that later! The Customer Care Performance Gap: [caption id="attachment_20871" align="aligncenter" width="570"]

The Care Performance Gap: On average, top performers are 33% more efficient than bottom performers.[/caption]Next we looked at data from customer care teams. Here, we focussed on efficiency, namely average handle time (AHT), or the average duration of a customer interaction. Using AHT allowed us to associate agent performance with a dollar value. On average, top performers were 33% more efficient than the bottom performers. For every conversation a bottom performer completed in 27 minutes, a top performer would finish in 20 minutes. Looking across organizations, if all agents were as efficient as top performers, operating costs could be reduced between 14% - 25% per year. For a $100M customer care operation, that means $14M - $25M in savings each year!
Looking across organizations, if all agents were as efficient as top performers, operating costs could be reduced between 14% - 25% per year. For a $100M customer care operation, that means $14M - $25M in savings each year!
Contributing behaviors: What behaviors drove these customer care inefficiencies?[caption id="attachment_20863" align="aligncenter" width="535"]
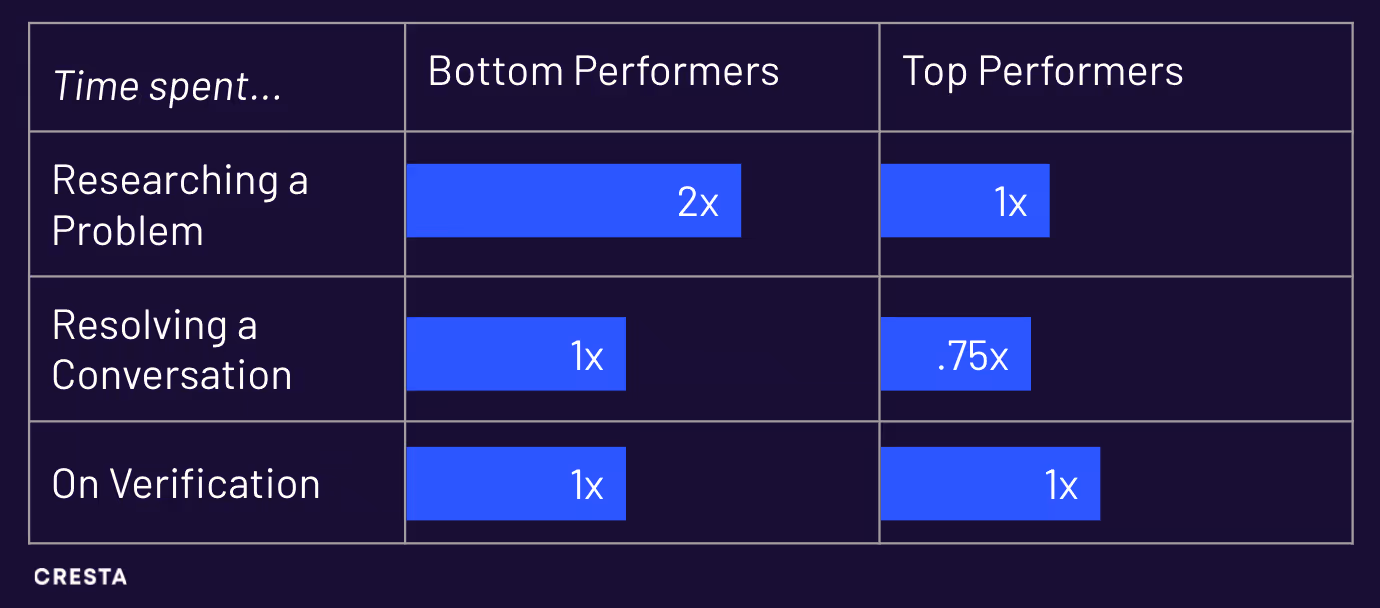
The top-3 behaviors contributing to the Care Performance Gap[/caption]
- Researching a problem: To address a customer problem, agents must first determine the root cause of the problem and then research a solution to the problem. We found top performers were 2x faster at researching and finding solutions than average performers.
- Responding to and resolving a conversation: With the solution identified, agents must then walk customers through the solution. Once a solution had been identified, top performing agents were consistently 25% faster at resolving the customer inquiry.
- Verification: In many cases, the verification process took up to 30% of the conversation. Interestingly, the time spent verifying a customer’s identity did not vary between top performers and everyone else, highlighting the need for faster and more streamlined verification processes.
What can you do to bridge the Performance Gap? Addressing the Performance Gap clearly offers significant ROI. Here are a few steps and practices you can follow to bridge this gap.
- Invest in actionable training: Making training and coaching actionable is key. Earlier we mentioned “Be better at overcoming objections!” isn’t the easiest piece of coaching to process. What's more helpful is coaching teams on how they can overcome objections. Even better is having software that coaches teams as they're talking to customers. Consistent with our findings, the Huffington Post found companies who invest in training can see 24% higher profit margins, and a happier and more engaged workforce.
- Make product knowledge easier to find: It’s clear that top-performers have a better grasp of the products and services they’re selling. To make conversations easier to resolve, invest invest in grooming knowledge-base articles and making product knowledge easy for agents to search and navigate while talking to customers.
- Stick to the script: Ensure ‘sticking to the script’ becomes a core part of performance and quality assurance (QA) evaluations. Teams that are able to adhere to methodologies see improved performance. With one group, we found agents who stick to the script generate 26% more revenue per conversation and have a 21% better conversion rate than their peers.
- Learning takes time and repetition: Remember, we’re human and we’re forgetful. It’s easy to forget training and coaching during customer conversations. Repeat training and allow ample time for new skills to be absorbed. Hermann Ebbinghaus’s forgetting curve suggests we forget 50% of new information within an hour of learning it, and 70% within 24 hours.
- Retention, retention, retention: As simpler tasks are automated, teams must handle more complex customer interactions. This requires a strong grasp of your customers and your products. With average ramp times ranging from 3-6 months, average contact center turnover rates between 30-45%, and an average tenure of 1 year, it’s easy for teams to suffer from the ‘Revolving Door’ with representatives leaving right as they become fully ramped. Retention is key to driving team performance.
- Invest in software and tools: Quality assurance and speech analytics software can surface insights like “Who are my top performers?”, “How empathetic is my team?” or “How much faster are my top performers at answering pricing questions?" Emerging solutions (including Cresta) go a step further and put insights into action, actively coaching agents while they're talking to customers. In a future blog post, we’ll dig into these tools and what to look for when evaluating solutions to help you bridge the Performance Gap.
We hope this post highlights how valuable improving team performance can be for your business, and the low-hanging fruit the Performance Gap represents. If you’d like to chat, learn more, or calculate what the Performance Gap means for your business, please reach out to us at pro@cresta.ai. Note on our methodology: At the beginning of engagements with clients, Cresta conducts a baseline evaluation of a client’s Performance Gap to identify key opportunities for improvement. We monitor the improvement in this Performance Gap for our customers. The data represented here is a composite across a subset of our customer and has been abstracted to protect the privacy of our customers.