

.png)

AI agents in production are not single model calls. A customer might just receive a generated response, but it takes the agent much more: Intent detection, knowledge retrieval, tool execution, and safety validation, most of them multiple times, each with its own model, latency profile, and failure mode. From the customer's perspective, the interaction usually ends in a voice reply or a text message. That surface-level outcome can look fine even when the retrieval step returned irrelevant documents or the guardrail silently rewrote the output.
What you need is a trace of each step in the agent's pipeline: what was the input, what was the output, how long did it take, and how much did it cost. Knowing what is going on is the first step you need to take to evaluate, improve, and scale your agents in the long run.

In this post, we discuss how we use Langfuse, an open-source LLM observability platform, to trace our AI agent pipelines in development and production. We cover the infrastructure decisions around self-hosting, multi-tenant isolation, and cross-service propagation that make it work at scale.
Tracing Agent Pipelines
Langfuse organizes AI agent execution into trace trees. Each node represents a typed observation (an LLM generation, a retrieval lookup, a tool call) with structured fields appropriate to that type. A single agent turn produces a tree like this:
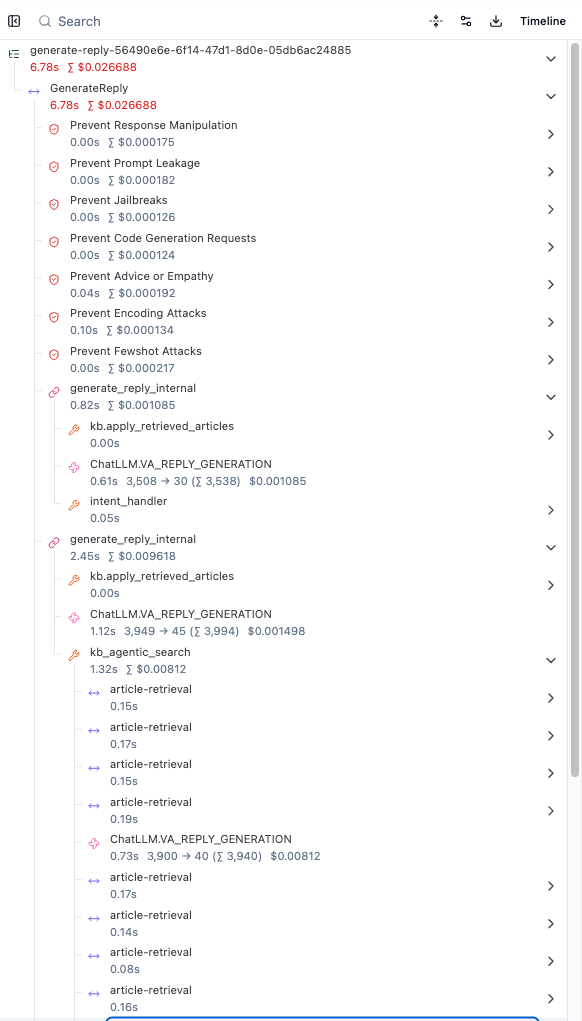
Each node captures structured data appropriate to its type: prompts and completions for generations, document counts and relevance scores for retrievals, pass/fail results for guardrails. This granularity turns debugging from "something is slow" into "the response synthesis step used 3x the expected tokens because the retrieval returned policy documents in two languages." Because observations are typed, you can also query across traces: surface all generations where total_tokens > 2000, or filter retrievals by document count to find cases where the knowledge base returned too many or too few results.
Self-Hosting and Data Sovereignty
We self-host Langfuse rather than using a managed SaaS offering. Traces capture the content of customer conversations, and even though personally identifiable information (PII) is always redacted before recording, keeping trace data within our infrastructure boundary is a hard requirement.
We deploy one Langfuse instance per Kubernetes cluster, co-located with the services that produce traces:
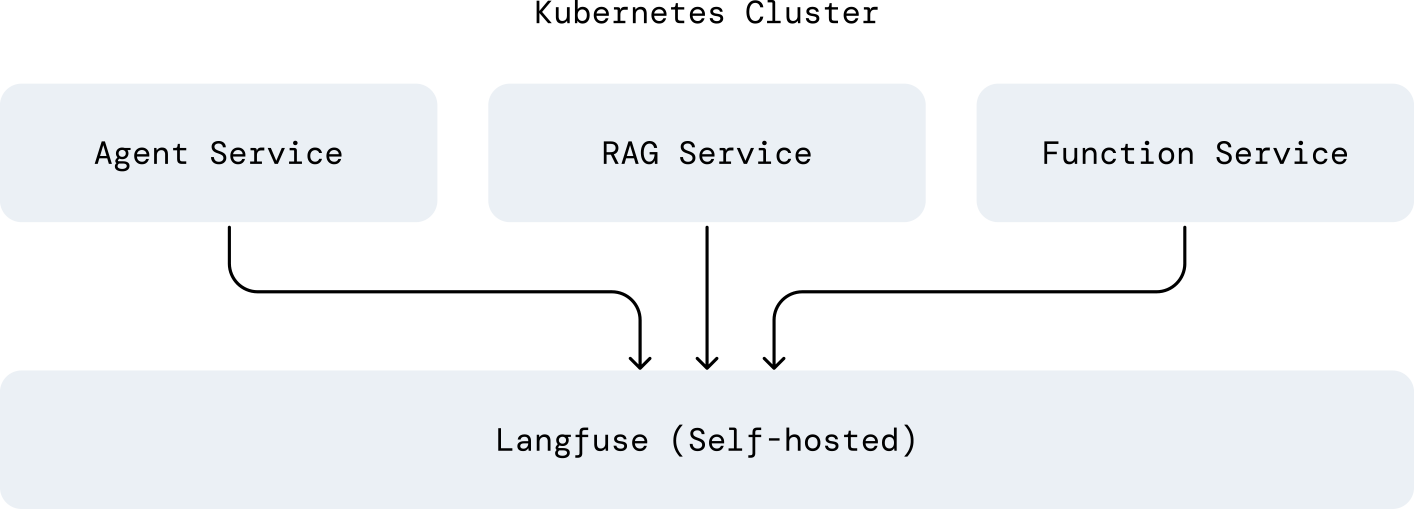
No trace data leaves the cluster boundary. This also gives us direct control over retention policies, backup schedules, and resource allocation. We ensure all tracing data is auto-deleted within four weeks with these policies.
Multi-Tenant Trace Isolation
In a multi-tenant environment, trace isolation is a compliance requirement. Different customers have different data handling agreements, and the underlying conversation data requires strict segregation even after PII redaction.
We use per-customer Langfuse organizations, each with its own API credentials. When a trace is created, the tracing library resolves the correct credentials based on the customer context from the incoming request. Service developers never handle API keys or routing logic directly:
with start_retrieval("knowledge-search") as span:
    docs = await vector_store.search(query)
    span.set_output({"doc_count": len(docs)})

# The tracing library automatically:
# 1. Reads customer_id from the request context (set by auth middleware)
# 2. Resolves credentials for that customer's Langfuse organization
# 3. Exports the span to the correct destination
Customer A's traces are physically separated from Customer B's, with no possibility of cross-contamination, even when both are served by the same pods.
Cross-Service Trace Propagation
A single customer interaction often touches multiple services: a Go agent service, a Python RAG pipeline, a separate function bundle for tool execution. The trace needs to follow the request across all of them.
We propagate trace context through gRPC metadata headers, injected and extracted by interceptors on each service:
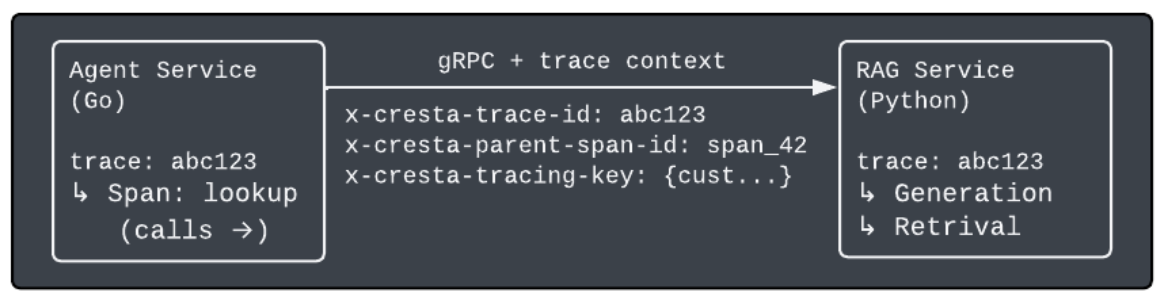
The downstream service joins the existing trace without any manual setup. Each service initializes its own root span, and any observations it creates nest under that root. Both services export their spans independently, and Langfuse reconstructs the full tree from matching trace and span IDs. In the Langfuse user interface (UI), an engineer sees the complete cross-service picture:
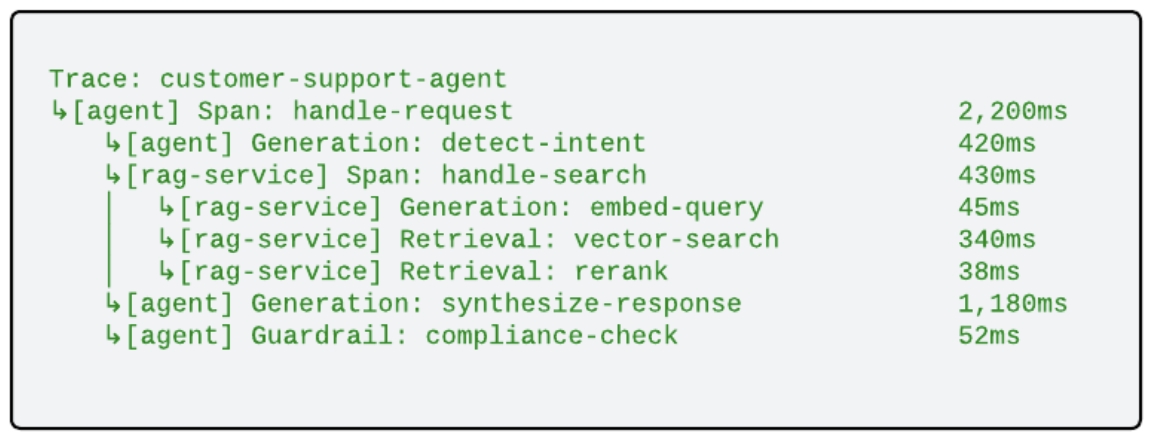
The full call tree, stitched together across language boundaries, with no manual ID threading or log correlation.
Debugging Agent Chains with Trace Data
Seeing the full trace across services is useful for latency and cost analysis, but the real value is in debugging the agent pipeline end to end. An agentic pipeline is a chain of LLM calls where each step's output feeds into the next. When the final response is wrong, the root cause is often not the last generation. It is usually a misleading intermediate output several steps earlier that sent the rest of the chain in the wrong direction.
Without structured traces, this is extremely difficult to diagnose. The final response looks wrong, but the logs for each individual step may appear reasonable in isolation. The problem only becomes visible when you can see the full chain of prompts and completions in sequence and identify exactly where the chain diverged.
This is where the typed trace tree pays off. Each Generation node records the full prompt, including any context injected from prior steps, and the completion returned. Walking the tree from root to leaf, you can identify the specific step where the output diverged.
Maybe an intent detection returned "billing inquiry" when the customer was actually asking about a service cancellation, and every downstream step (retrieval, response generation, tool selection) followed that incorrect signal faithfully.
The trace makes the causal chain explicit. Rather than hypothesizing about what went wrong and re-running the pipeline with debug logging, the engineer can see each prompt, each completion, and each handoff between steps.
Langfuse’s sandbox takes this a step further. Once our engineering team has identified a problematic generation, they can replay the chain from that point with updated models, generation settings, and prompts, keeping all prior inputs and context frozen. They tweak the request, re-run, and immediately see how the change propagates through the rest of the chain. The iteration cycle goes from “deploy a change and wait for a similar request” to “replay this exact failure with a candidate fix in seconds.”
What Comes Next
LLM observability is a relatively young discipline, and there are several directions we are actively exploring:
- Evaluation scores on traces: attaching automated quality scores (relevance, faithfulness, coherence) directly to trace observations, tightening the loop between production behavior and offline evaluation.
- Prompt engineering co-pilot: Canvas-style drafting and tuning for non-technical users, with quick actions (refine, format, shorten) and guided conversation aligned to prompt best practices. Optional inputs such as Langfuse traces, eval runs, and plain-language feedback ground suggestions in observed behavior while we avoid overfitting to a single metric.
- Regression detection across prompt versions: comparing trace-level metrics before and after a prompt change to quantify impact, rather than relying on offline evaluation alone.
The more precisely you can see what an AI agent is doing, the more effectively you can improve it. Observability is not a separate concern from AI agent quality. It is a prerequisite for it.
We think a lot about this problem because it’s foundational: you can’t improve what you can’t see. As agent systems get more complex, observability becomes the lever that makes them reliable, debuggable, and ultimately useful in production.
That’s the direction we’re building toward at Cresta. And if working on systems like this sounds interesting, we’re hiring. Come build with us.